Making Sense of the Noise: The Big Data Concept and Information Analysis Process
Imagine trying to listen to a single conversation in a crowded, noisy stadium. That’s essentially the challenge we face in today's digital world. We're surrounded by a colossal, continuous stream of information—sales figures, social media posts, sensor readings, website clicks, customer reviews. This is Big Data. It’s not just a lot of data; it’s data that is so vast, complex, and fast-moving that traditional tools can't handle it. The Information Analysis Process is how we find that one meaningful conversation in the stadium. It’s the structured method of collecting, cleaning, examining, and interpreting this data to uncover patterns, answers, and opportunities that would otherwise remain hidden.
Why This Isn't Just for Tech Giants
You might think this is only for multinational corporations with server farms, but the core concept is deeply practical for almost anyone trying to make a smarter decision. Whether you're a freelancer deciding which service to focus on, a small shop owner understanding local buying trends, or a blogger figuring out what your readers truly want, you are dealing with your own version of big data. The Information Analysis Process provides a mental framework—a way to think systematically about the information you already have or can collect.
The Real-World Cycle: From Chaos to Clarity
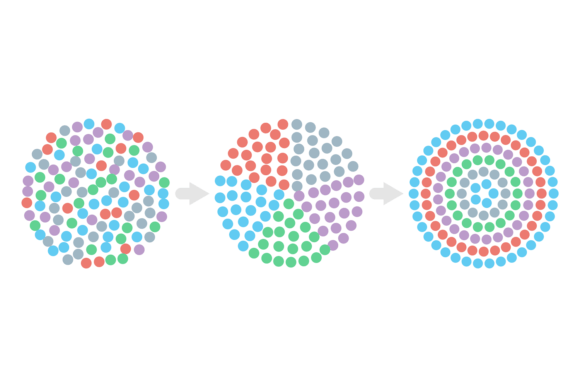
This process isn't a mysterious black box. It follows a logical, often iterative, path. First, you identify and collect relevant data. For a marketer, this might be pulling analytics from Instagram, email campaigns, and online store visits. Next, you process and clean it. This crucial step is like tidying up a workshop before building something—removing duplicate entries, correcting formats, filtering out irrelevant noise. Then comes the actual analysis, using methods from simple spreadsheet sorting to more complex statistical models to find relationships and trends. Finally, you interpret and visualize the results, turning numbers into a comprehensible chart or a clear strategic insight that can be acted upon.
An educator, for instance, might use this process with student performance data. Collecting quiz scores, attendance records, and participation logs. Cleaning it to ensure consistency. Analyzing it to see if a specific teaching method correlates with better outcomes in a particular topic. Visualizing the results might show a simple bar chart revealing that hands-on projects boost comprehension by 40%. The outcome isn't just a graph; it's a decision to allocate more class time to project-based learning.
Where It Comes Into Play: Your Daily Decisions
Let's move beyond abstract theory and into the places where this concept actively shapes outcomes.
For Creators and Entrepreneurs
A podcaster isn't just creating content; they're running a micro-business. Applying the Big Data Concept and Information Analysis Process means looking at download numbers, listener demographics from different platforms, episode engagement drop-off points, and social media buzz. Analysis might reveal that deep-dive interviews retain listeners longer than news roundups, and that a significant portion of the audience uses Spotify at commute times. The real outcome? The podcaster shifts production to longer-form interviews and schedules new releases for early morning, directly impacting growth and loyalty.
For Retail and Lifestyle Businesses
A neighborhood coffee shop owner notices seasonal sales fluctuations. The big data here is daily sales receipts, inventory usage, weather data, and local event calendars. By analyzing this information together, a pattern emerges: sales spike not just on cold days, but specifically on rainy weekends when a nearby farmers' market is open. The interpretation leads to a practical action—the owner prepares extra stock and staff on those days, and even runs a targeted "Market Day Blend" promotion, turning a vague observation into a precise, profitable strategy.
For Personal Projects and Hobbies
Even a hobbyist training for a marathon generates personal big data: run distances, times, heart rate readings, sleep data from a smartwatch, nutritional logs. The Information Analysis Process helps them move beyond just logging. By analyzing correlations, they may discover that their best performance times consistently follow nights with over 7 hours of sleep and meals rich in certain carbs, while poor runs correlate with late-day caffeine. The benefit is a personalized, evidence-based training regimen that dramatically increases their chances of success.
What to Consider Before You Dive Into Analysis
The power of this approach is clear, but applying it thoughtfully is key to getting real value, not just more charts.
First, start with a question, not just data. Ask "What am I trying to understand or improve?" before you gather anything. Are you trying to increase customer retention? Optimize your website's user flow? Reduce personal monthly expenses? The process serves the question, not the other way around.
Second, respect privacy and ethics. Especially for small businesses and creators, the data you use often comes from customers, clients, or followers. Be transparent about what you're collecting and why. Use it to serve them better, not to manipulate. This builds trust and aligns with the E-E-A-T principles of expertise, authoritativeness, and trustworthiness that underpin credible content.
Third, acknowledge the tools gap. The concept is universal, but the tools vary wildly. A blogger might start with free Google Analytics and spreadsheet pivot tables. A growing e-commerce store might need a dedicated CRM or business intelligence software. Consider your technical comfort, the volume of data, and your budget. Often, the best starting point is a simple, focused analysis of one or two key data streams rather than attempting a complex, all-encompassing system.
Finally, embrace iteration. The Information Analysis Process is rarely a one-and-done event. You'll analyze, get an insight, try a change, and then collect new data to see the effect of that change. It becomes a continuous cycle of learning and refinement. The freelance graphic designer, for example, analyzes which project types bring the highest client satisfaction and referrals. They then focus their portfolio on those types, track new inquiry sources, and analyze again to see if the shift worked. The process becomes embedded in their business growth.
The Tangible Benefit: From Guesswork to Guided Action
The ultimate value of the Big Data Concept and Information Analysis Process is the replacement of intuition and guesswork with guided action. It turns the overwhelming flood of modern information into a strategic asset. For the educator, it's a better curriculum. For the entrepreneur, it's a more effective marketing spend. For the hobbyist, it's a more achievable personal goal. By adopting this structured approach to thinking about information, you stop being passive amidst the data noise and start actively listening for the signals that matter most to your success, growth, and understanding.