Harnessing Colorful Workflow: A Visual Guide to Clearer Processes
In a world saturated with data and complex procedures, the ability to communicate and understand workflows is paramount. Whether in business, research, or daily life, seeing the steps, connections, and outcomes of a process can transform confusion into clarity. This is where the concept of a colorful workflow comes into play. Far more than just an aesthetic choice, the strategic use of color in flowcharts, diagrams, and infographics is a powerful tool for enhancing comprehension, engagement, and efficiency. This article explores this vibrant visual concept from the ground up, explaining its purpose, significance, and practical applications across various fields.
What is a Colorful Workflow, Exactly?
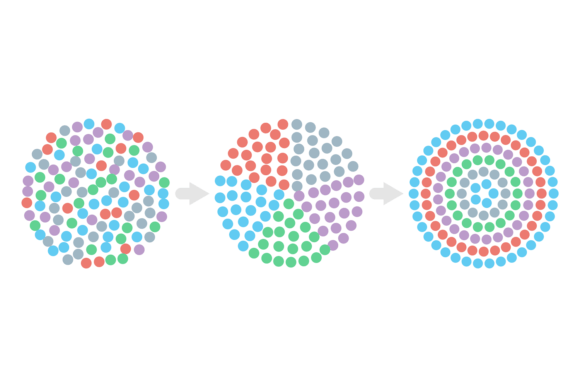
A colorful workflow is a visual representation of a process, sequence, or system where distinct colors are systematically applied to different elements. Unlike monochromatic diagrams, these visuals use color coding to categorize stages, highlight priorities, indicate status, or distinguish between types of actions or data. The core idea is to leverage the innate human psychological response to color to make information more accessible and memorable.
Think of it as moving from a black-and-white instruction manual to a vividly illustrated guide. Each color serves a specific function:
- Red might denote critical alerts, stopping points, or high-priority tasks.
- Green often signals progression, completion, or "go" actions.
- Blue can represent information inputs, data collection, or neutral steps.
- Yellow/Orange may highlight pending actions, reviews, or cautionary phases.
This approach transforms a linear sequence of boxes and arrows into a intuitively navigable map. The color becomes part of the information itself, not just decoration.
The Purpose and Significance: Why Color Matters
The purpose of implementing color in workflows is multifaceted. Primarily, it addresses cognitive load—the mental effort required to process information. A well-color-coded chart reduces the time and energy needed to decipher relationships and roles within a process.
Its significance lies in several key areas:
- Enhanced Comprehension: Color groups related elements visually, allowing viewers to grasp complex systems faster. It supports pattern recognition, which is a fundamental way our brains understand the world.
- Improved Communication: In team settings, a colorful workflow acts as a universal language. A sales team, for example, can instantly see that all "client onboarding" stages are in blue, while "contract finalization" steps are in green, streamlining meetings and training.
- Error Reduction: By making deviations or missing steps visually obvious (e.g., a red "approval" box that hasn't been filled in with a completion color), color coding can prevent process errors.
- Increased Engagement: A visually appealing diagram is more likely to be consulted, remembered, and used than a plain one. This is crucial for internal documentation, educational materials, and client-facing reports.
Colorful Workflows in Action: Practical Relevance Across Fields
The application of colorful workflow and research concepts is vast, fitting seamlessly into modern professional and educational environments.
In Business and Financial Reporting
For business, especially in financial reports and presentation slides, color is indispensable. A financial process flowchart might use:
- Gold or dark blue for revenue-generation steps.
- Gray for compliance and auditing checkpoints.
- Red for risk assessment phases.
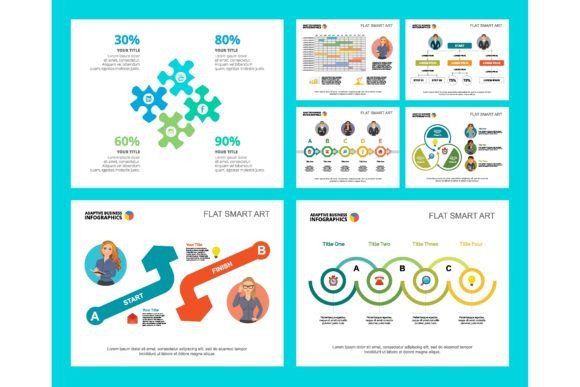
In a quarterly presentation template, a colorful workflow chart showing the product development cycle can instantly communicate which stages are on track (green), delayed (yellow), or requiring intervention (red). This transforms dry data into a dynamic, actionable story for stakeholders.
In Research and Development
Research concepts often involve intricate methodologies. A colorful research process infographic can delineate between:
- Literature review (in a calm blue).
- Experimental phases (in an active orange).
- Data analysis (in a precise purple).
- Conclusion and publication (in a conclusive green).
This helps researchers, students, and funding bodies visualize the project's structure and progress at a glance, making complex academic work more approachable.
In Brochure Design and Client Communication
Service-based businesses often use brochures to explain their service journey. A colorful workflow layout here guides the potential client through the steps—from initial consultation (soft teal) to service delivery (bright green) to follow-up support (warm yellow). This not only informs but also builds confidence by presenting a transparent, organized, and professional process.
In Daily Activities and Personal Productivity
The principle extends beyond corporate walls. Personal productivity apps use color coding to manage to-do lists. A home renovation plan might use a colorful flowchart to sequence tasks: permits (orange), demolition (gray), construction (brown), finishing (gold). Color helps manage personal projects with the same clarity as business ones.
Building an Effective Colorful Workflow: Key Considerations
Creating a useful colorful workflow isn't about using every hue in the palette. It requires thoughtful design grounded in purpose.
1. Establish a Consistent Color Code
The system must be consistent and documented. If "blue means data input" in one part of the chart, it must mean that throughout. A legend or key is often essential. This consistency is what builds intuitive understanding over time.
2. Consider Audience and Context
Cultural connotations of color matter. While red often signals danger or stop in many contexts, it can signify prosperity in others. Also, consider accessibility: ensure sufficient contrast for viewers with color vision deficiencies and use text labels as a backup to color information.
3. Align with Branding When Appropriate
For business templates, integrating brand colors into the workflow can reinforce identity. A company with a primary brand color of navy blue might use shades of that blue for all core process steps, accenting with secondary colors for specific actions.
4. Balance Complexity and Simplicity
Don't let the chart become a rainbow puzzle. Limit the number of distinct colors to what is necessary for differentiation—often 4-6 key colors are sufficient for even complex processes. Too many colors can reintroduce the confusion you're trying to eliminate.
Clarifying Common Misunderstandings
There are a few assumptions worth addressing to build a broader, correct understanding of this concept.
Misunderstanding 1: It's Just for Looks. The most common error is viewing color as merely decorative. In effective workflow design, color is a functional data layer. Its primary job is to carry meaning and improve usability, with aesthetic appeal being a beneficial side effect.
Misunderstanding 2: Any Color Scheme Works. Random or purely artistic color choices can undermine the goal. The scheme must be logical and designed for the specific content and audience. A workflow about environmental processes might naturally lean towards greens and blues, while a cybersecurity incident response chart might use a more urgent palette of reds, oranges, and blacks.
Misunderstanding 3: It Replaces Text. Color does not replace clear textual labels. It complements them. A box should still read "Budget Approval," even if it's also colored gold. The color reinforces the text, not substitutes for it.
The Broader Impact: A Tool for Universal Understanding
Ultimately, the adoption of colorful workflow and research infographics speaks to a larger trend in how we manage information in the 21st century. We are moving towards visual synthesis—combining data, process, and design to create tools that are quickly understood across disciplines, expertise levels, and languages.
In education, it makes complex subjects digestible. In technology, it maps user journeys and software architectures. In daily life, it helps us plan and communicate. By harnessing this concept, individuals and organizations can cut through noise, align teams, and present ideas with powerful clarity. The next time you encounter a financial report slide, a research poster, or a service brochure, look for the color coding. You'll likely find it’s not just making the page prettier—it’s guiding your eye and your mind through the story, step by vibrant step.
Whether you are designing a presentation template, laying out a brochure, or simply trying to organize your own projects, starting with a colorful workflow map can be your first step towards not only doing work, but seeing it done.